Travel to school hands up survey 2025
Every September, we ask all schools in Central Bedfordshire to take part in our hands up travel survey. The survey asks pupils how they usually travel to school. In 2025, all schools took part, which represents 41,846 pupil journeys. These results exclude pupils who attend SEND schools.
How pupils travelled to school in 2025
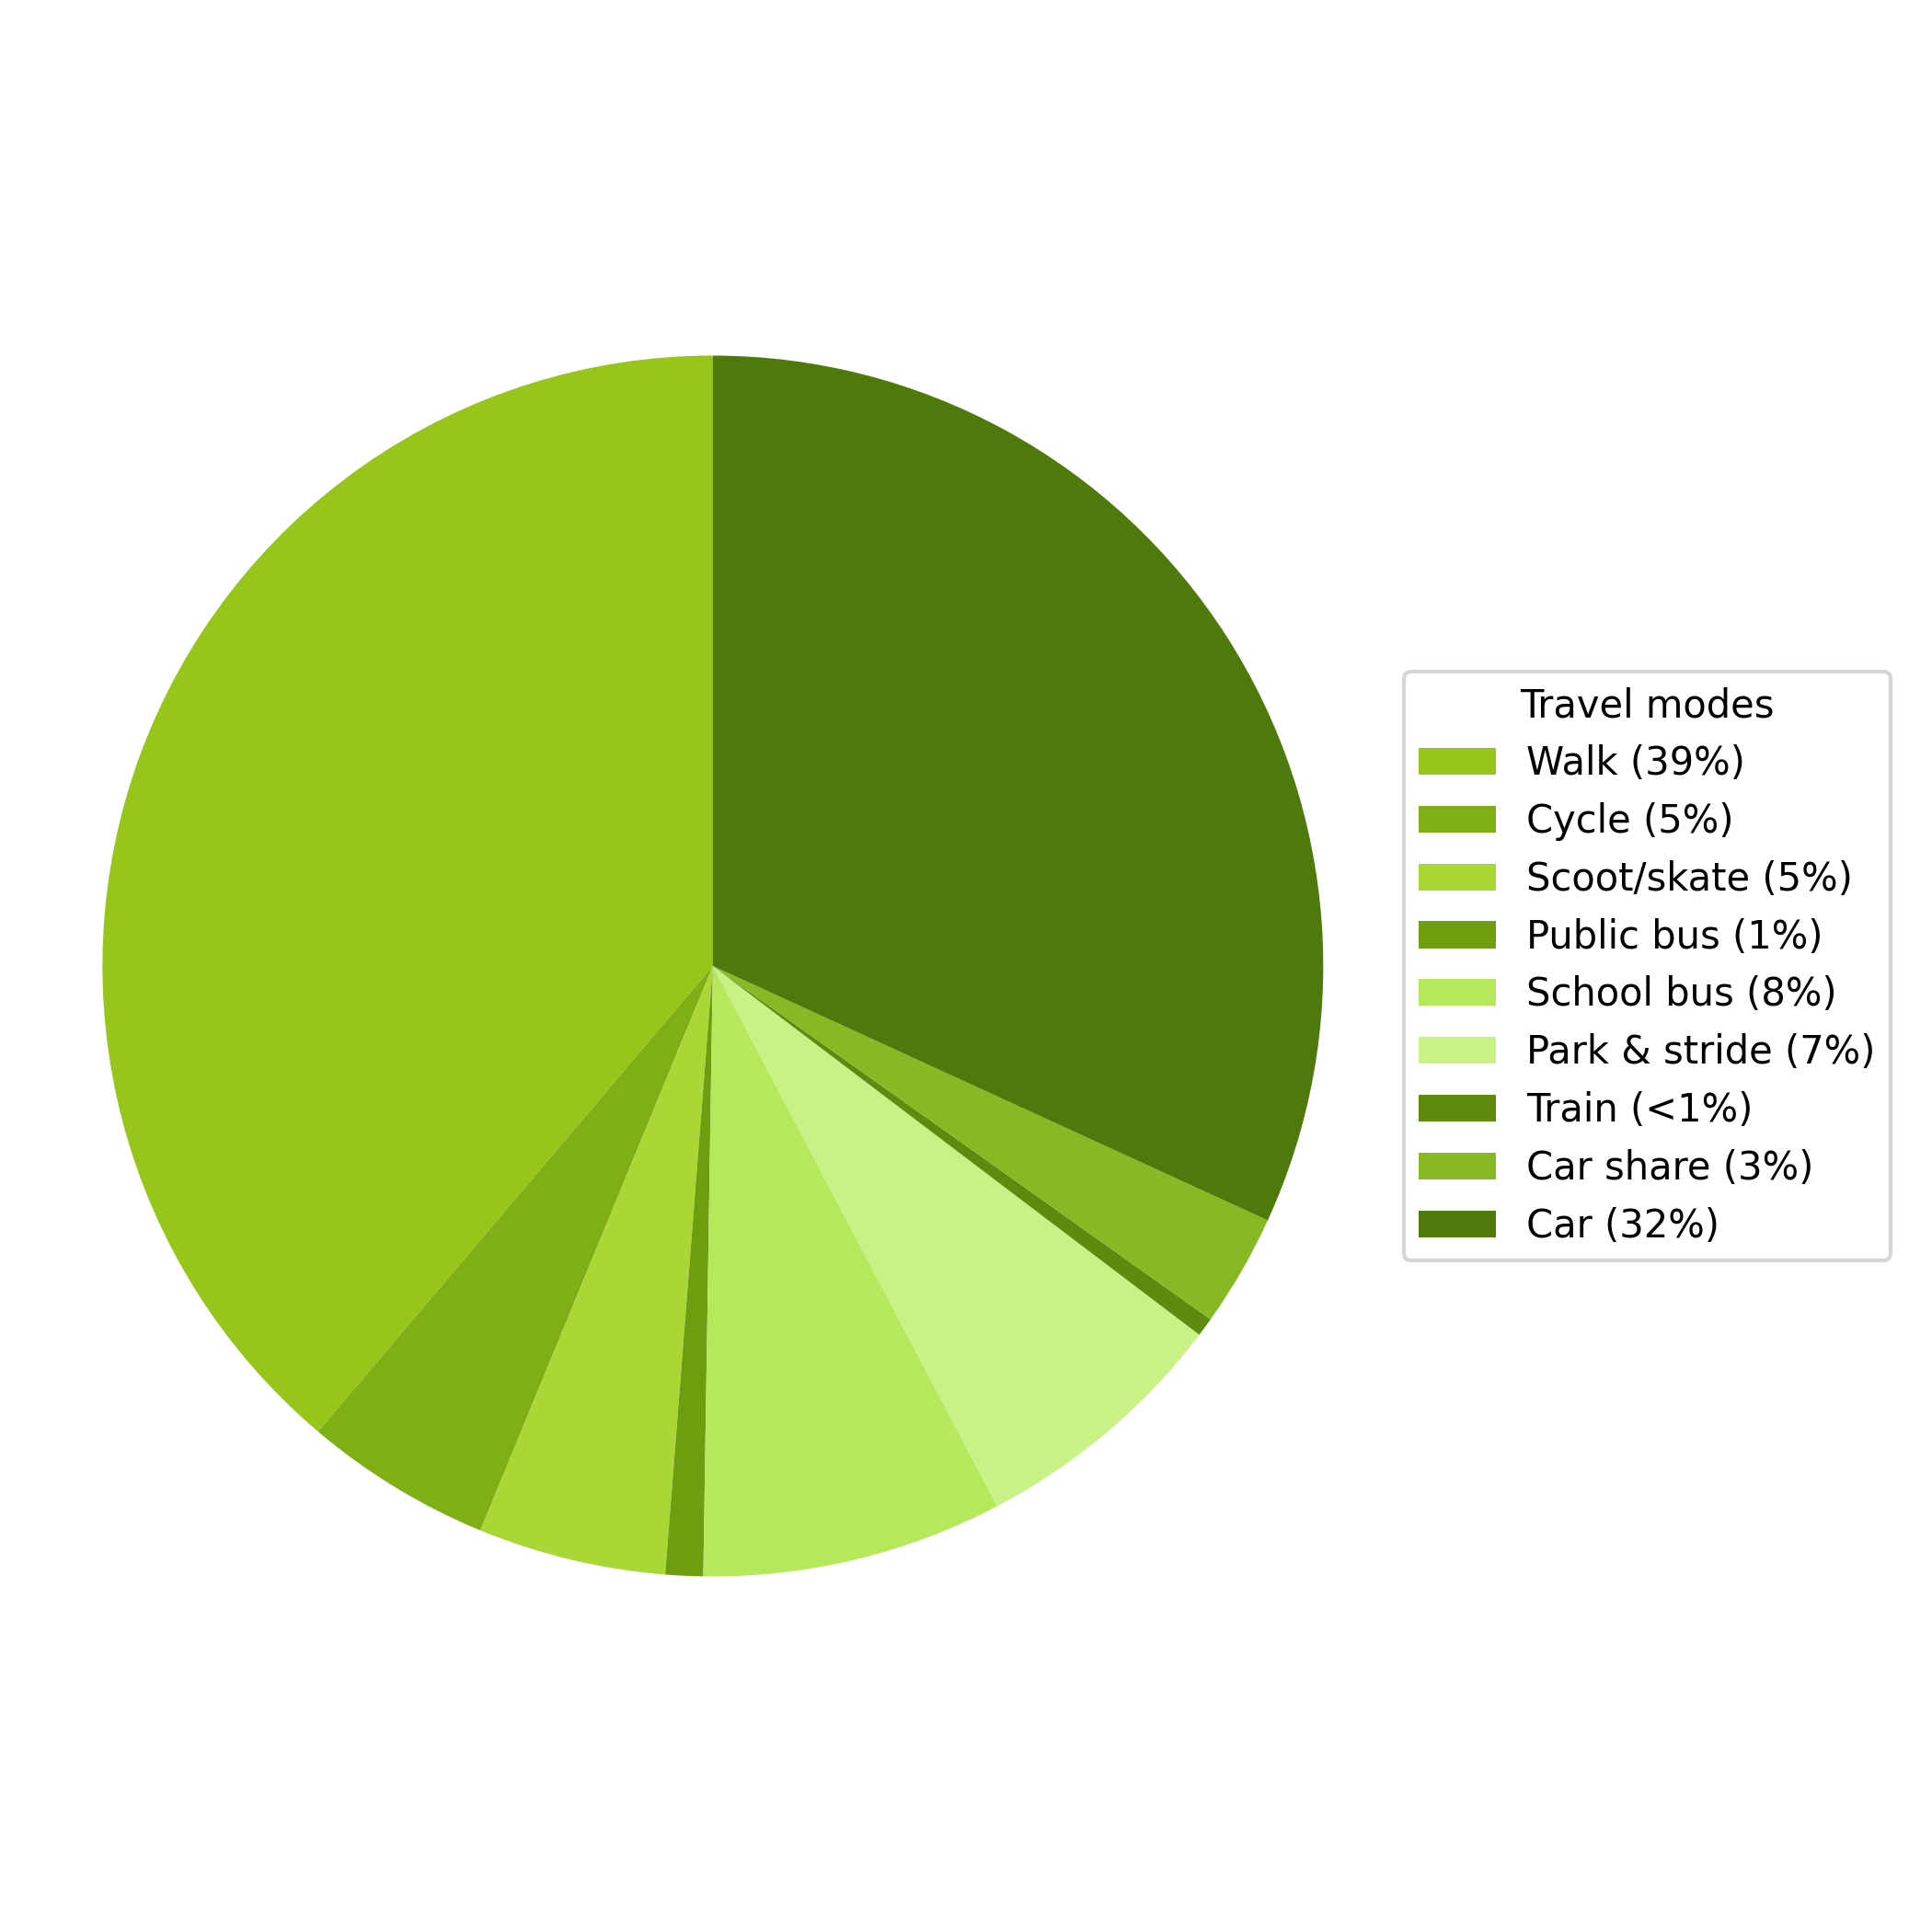
Accessible description of the chart:
The travel results show that 39% walk, 5% cycle, 5% scoot or skate, 1% use a public bus, 8% use a school bus, 7% use park and stride, fewer than 1% travel by train, 3% car share and 32% travel by car.
Key findings from the 2025 survey
For all schools in Central Bedfordshire (excluding SEND schools):
- 49% of pupils use an active mode of travel (walking, wheeling, cycling, scooting or skating)
- 58% use an active mode or public transport (public bus, train or school bus)
- 35% travel by car or car share – this means 14,429 journeys happen twice a day on every school day
Schools with the highest levels of active travel
Lower and primary schools
- Dunstable Icknield Lower School, Dunstable – 86% active travel
- Greenleas School (Kestrel Way), Leighton Buzzard – 79% active travel
- Maple Tree Primary School, Sandy – 76% active travel
Middle schools
- Woodland Middle School Academy, Flitwick – 71% active travel
- Brooklands School, Leighton Buzzard – 67% active travel
- Alameda Middle School, Ampthill – 62% active travel
Secondary and upper schools
- Stratton School, Biggleswade – 76% active travel
- Edward Peake C of E School, Biggleswade – 67% active travel
- All Saints Academy, Dunstable – 67% active travel
Download the survey data
You can download all results for every school that took part in 2025:
Browse the 2025 hands up survey data folder (multiple CSV files)
How we use the hands up survey data
We use this data to:
- monitor travel behaviour over time
- support policies related to health, transport and education
- inform health, transport and education initiatives across Central Bedfordshire
How schools can use this data
Schools may choose to use the data to:
- support lessons in subjects such as maths, geography, climate change or road safety
- raise awareness of local travel behaviours
- develop or update a school travel plan
- support an Eco Schools application that includes the transport topic
Reducing the number of car journeys to and from school
32% of pupils in Central Bedfordshire travel to school by car each day. This equals 13,211 journeys twice a day on every school day. A further 3% (or 1,218 pupils) car share.
This creates a large number of vehicles arriving at the same time and competing for limited parking spaces near school gates, especially in areas not designed for high levels of traffic.
How far pupils live from their school affects whether active travel is an option. Central Bedfordshire includes both urban and rural areas, so travel choices differ by location.
We encourage every school to complete or update a travel plan. A school travel plan considers your school’s location and helps identify opportunities to increase sustainable travel.
For schools in urban areas
You may want to explore whether some pupils who are driven to school live within walking, wheeling, cycling or scooting distance.
For schools in rural areas
If travelling by car is the only reasonable option for some pupils, you may want to consider:
- promoting car sharing
- improving road safety outside the school
- introducing or promoting park and stride options
How Central Bedfordshire compares to the national average
The Department for Transport’s National Travel Survey (2023 to 2024) reports that, in England:
- 45% of pupils walk to school
- 2% cycle
- 37% travel by car or van
- 4% use a private bus (likely a school bus)
- 9% use a public bus
- 1% travel by train
- 2% use other modes
Central Bedfordshire’s results are broadly similar to the national average. Active travel levels are slightly higher, and car use is slightly lower, which is positive for a semi‑rural area.